As a seasoned automotive technician, you understand the value of accurate data when diagnosing vehicle issues. The VCDS software, a powerful diagnostic tool for VAG vehicles, offers a wealth of information, including the often-overlooked IQ (Injection Quantity) graph. This guide delves into how to access and interpret this crucial data to pinpoint fuel system anomalies.
Understanding the Importance of the IQ Graph
Before diving into the “how-to,” let’s establish the “why.” The IQ graph provides a visual representation of fuel injector performance, displaying the quantity of fuel injected per stroke in relation to engine speed and load. This information is invaluable for diagnosing:
- Injector Health: Uneven fuel delivery across cylinders, often indicated by significant variations in the IQ graph lines, can signify a failing injector.
- Fuel Pressure Issues: A consistently low or erratic IQ graph across all cylinders may point towards low fuel pressure, a clogged fuel filter, or a malfunctioning fuel pump.
- Air Leaks: Unmetered air entering the engine can disrupt the air-fuel mixture, potentially reflected in the IQ graph as lean conditions or fluctuating values.
Accessing the IQ Graph in VCDS
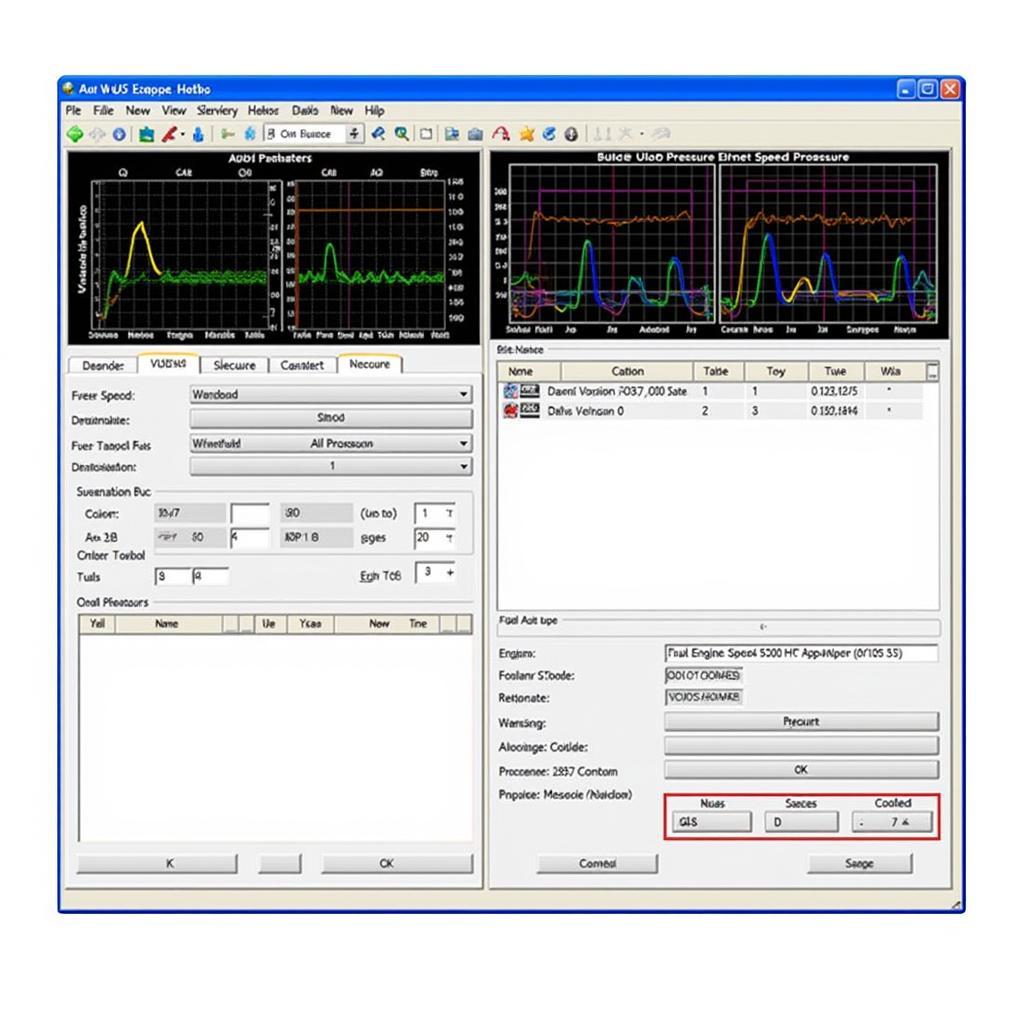
Navigating to the IQ graph within VCDS is a straightforward process:
- Connect: Connect your VCDS interface to the vehicle’s OBD-II port and establish communication with the vehicle’s ECU.
- Select Engine Module: Open VCDS software and select the “Engine” control module.
- Go to Measuring Blocks: Choose “Measuring Blocks” from the available options.
- Input Group Number: The specific group number displaying the IQ graph varies depending on the engine code. Consult your VCDS documentation or a reliable online resource to identify the correct group number for your specific vehicle.
- Start the Engine: With the engine running, observe the live data stream for the selected measuring block group. The IQ graph should be displayed, often alongside other relevant parameters.
Interpreting the IQ Graph
A healthy IQ graph typically exhibits tight, consistent lines for each cylinder, indicating balanced fuel delivery. Here’s what to look out for:
- Significant Deviations: Large discrepancies between the lines suggest an imbalance in fuel injection, potentially caused by a faulty injector or a wiring issue.
- Sudden Drops or Spikes: Abrupt changes in the graph may indicate intermittent fuel delivery problems, warranting further investigation of fuel system components.
- Overall Low Values: Consistently low values across all cylinders might point towards low fuel pressure or restricted fuel flow.
“When analyzing the IQ graph, it’s essential to consider the entire picture,” advises automotive electronics expert Dr. Emily Carter in her book “Advanced Automotive Diagnostics.” “Correlating the graph with other engine parameters, such as fuel pressure readings, can provide a more accurate diagnosis.”
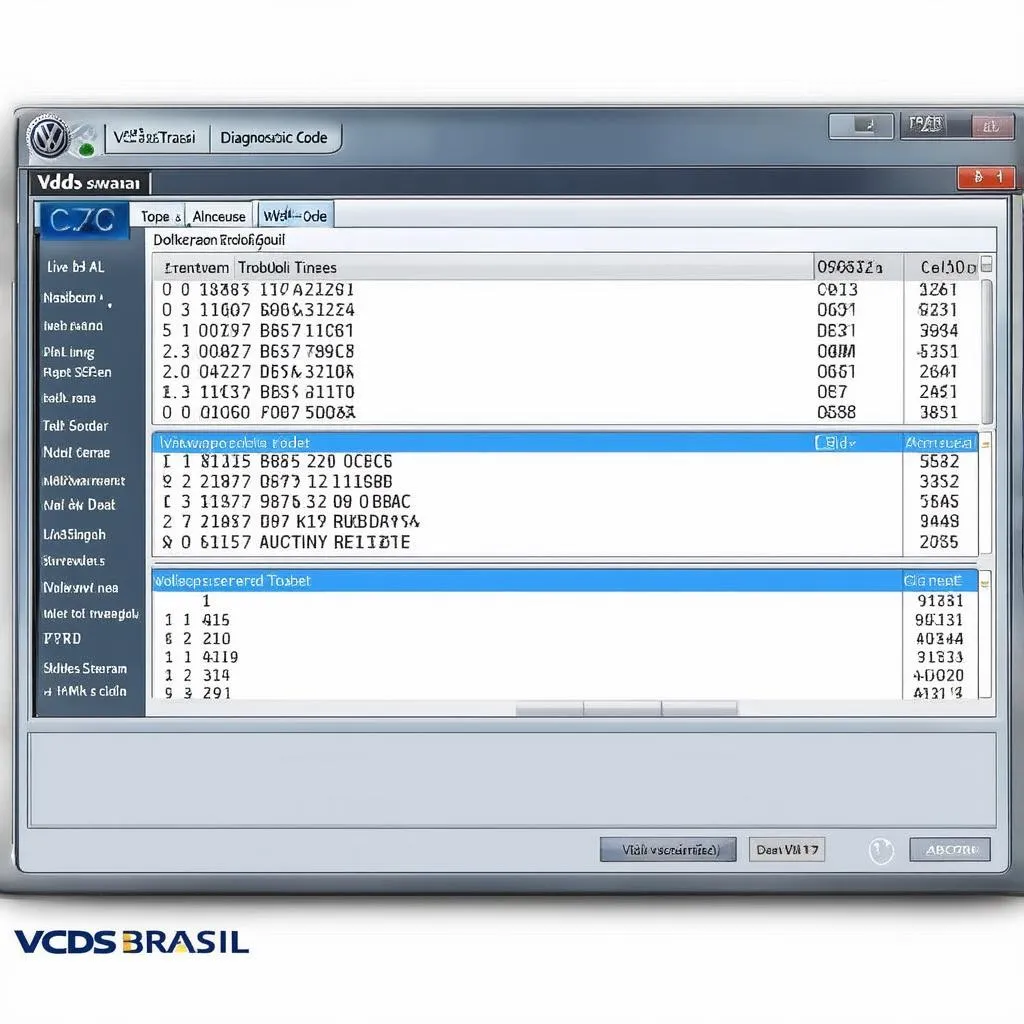
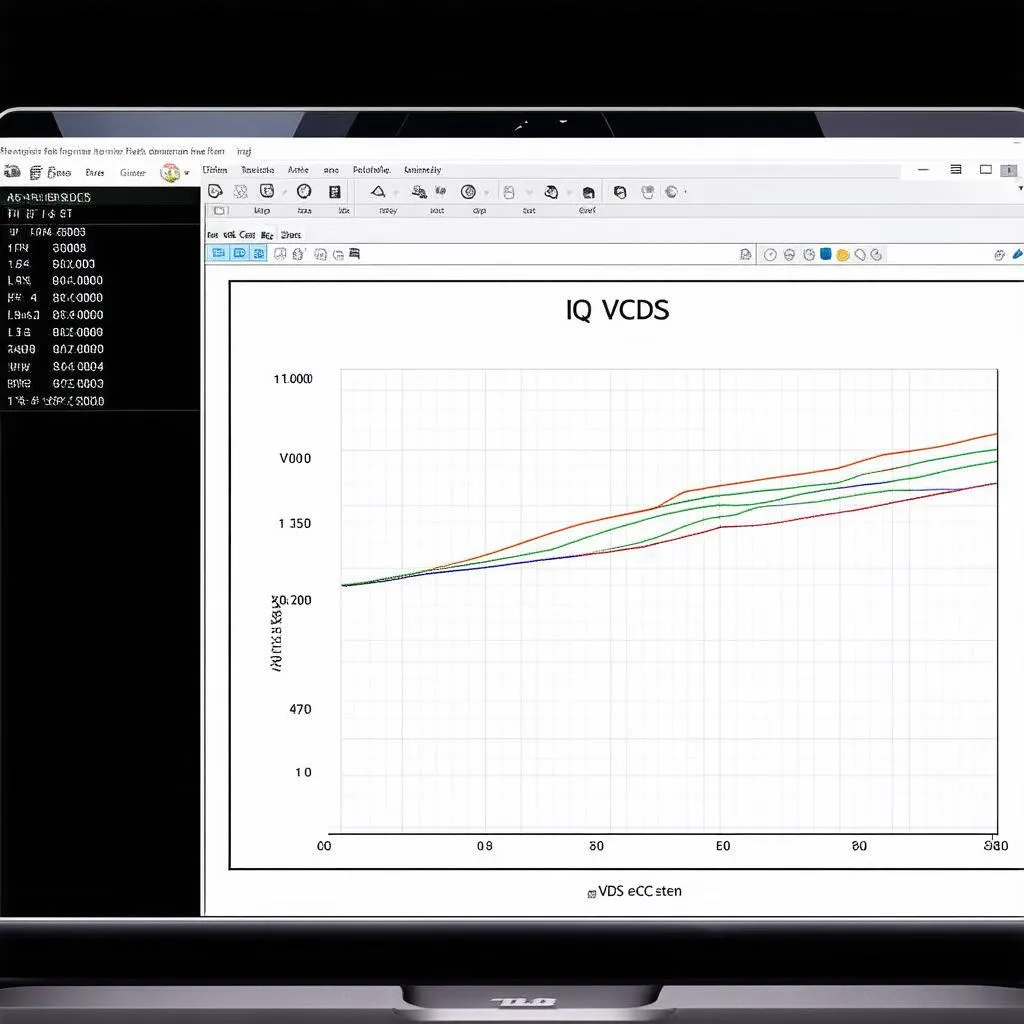 VCDS IQ Graph
Common Issues and Troubleshooting Tips
- No Graph Displayed: Ensure the correct measuring block group is selected for your engine code. Double-check your VCDS version and update if necessary, as older versions might not support the IQ graph for certain models.
- Erratic Graph: Begin by inspecting for vacuum leaks, loose connections, or damaged wiring within the fuel system. Consider cleaning the MAF sensor and checking for any related fault codes.
- Consistently Low Values: Focus on fuel delivery. Check fuel pressure with a gauge, inspect the fuel filter for clogging, and evaluate the fuel pump’s operation.
Leveraging Cardiagtech for Enhanced Diagnostics
For technicians seeking top-notch diagnostic solutions, Cardiagtech offers a comprehensive range of professional automotive tools and software. From advanced scan tools to specialized diagnostic equipment, Cardiagtech provides the resources needed to tackle complex automotive issues effectively.
Conclusion
The IQ graph in VCDS is a potent diagnostic tool that empowers technicians to unravel fuel system mysteries. By understanding how to access, interpret, and troubleshoot issues related to the IQ graph, you gain a significant advantage in efficiently diagnosing and resolving fuel-related problems in VAG vehicles.
Do you have further questions about utilizing VCDS or other automotive diagnostic tools? Reach out to the experts at CARDIAGTECH for personalized guidance and support.
 Mechanic Analyzing Data