The VCDS (VAG-COM Diagnostic System) software is a powerful tool for diagnosing and troubleshooting issues in Volkswagen Group vehicles. One of its many features, the VCDS Graph, allows you to visually monitor various engine parameters in real-time, providing valuable insights into your car’s performance. This article delves into the intricacies of VCDS Graph, exploring its functionalities, benefits, and how it can empower you to keep your vehicle running smoothly.
What is VCDS Graph?
VCDS Graph is a built-in module within the VCDS software that enables the graphical representation of live data streams from your vehicle’s Engine Control Unit (ECU). This feature allows you to observe the behavior of various sensors and components, making it easier to identify anomalies and diagnose issues.
“Using VCDS Graph is like having an x-ray vision into your car’s nervous system,” says John Miller, a seasoned automotive engineer, and author of “Automotive Diagnostics: A Practical Approach”. “It allows you to see the invisible, understand the interplay between different components, and pinpoint the root cause of a problem.”
How Does VCDS Graph Work?
VCDS Graph communicates with your vehicle’s ECU through the OBD-II port, typically located under the dashboard. It retrieves data from various sensors and displays them in real-time on a graph. You can choose the parameters you want to monitor, such as engine speed, boost pressure, coolant temperature, and many more.
 VCDS Graph Interface
Benefits of Using VCDS Graph
The ability to visualize live data offers several advantages:
- Simplified Diagnostics: Identifying issues becomes significantly easier when you can see how different parameters behave under various conditions.
- Proactive Maintenance: By observing trends and patterns, you can detect potential problems early on, before they escalate into major repairs.
- Performance Tuning: For enthusiasts, VCDS Graph can be instrumental in fine-tuning engine parameters to optimize performance.
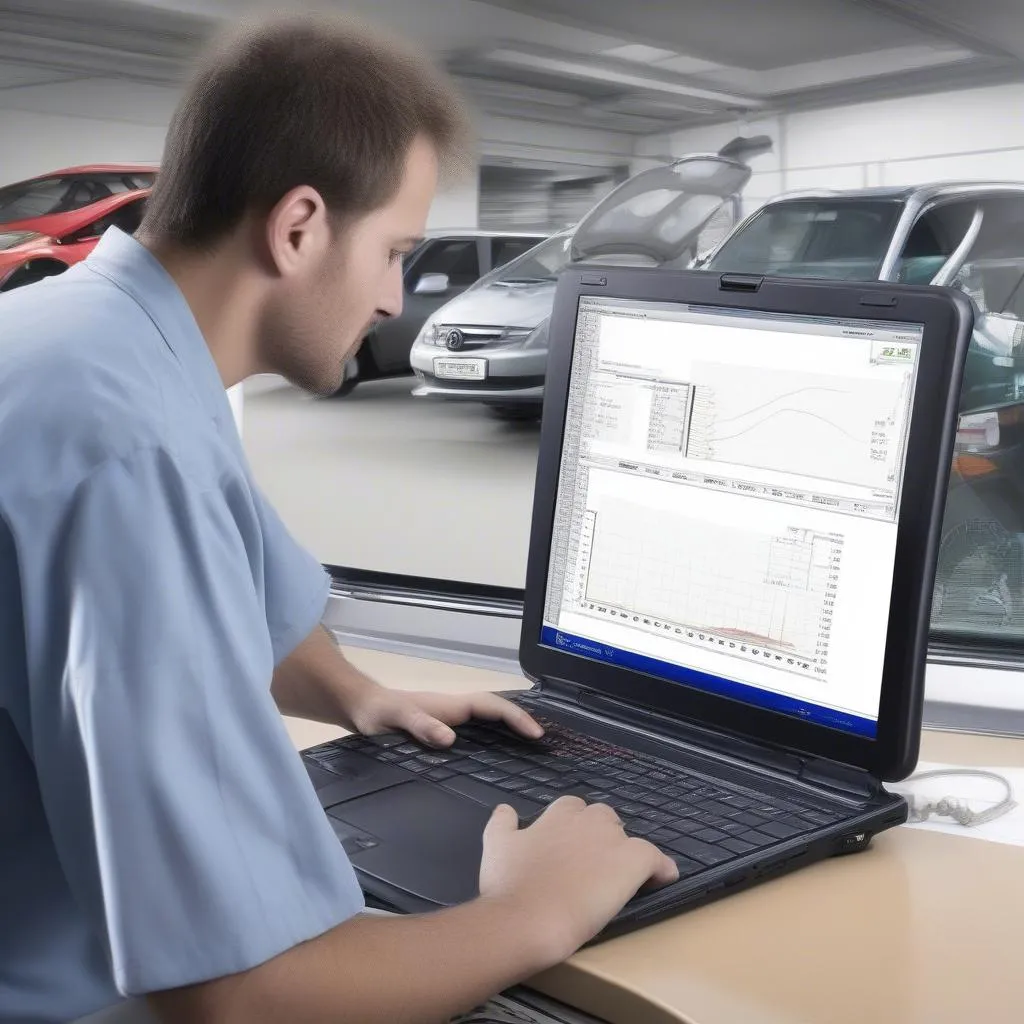 Mechanic Using VCDS Graph
How to Use VCDS Graph
Using VCDS Graph is relatively straightforward:
- Connect your VCDS interface to your vehicle’s OBD-II port and turn the ignition on.
- Launch the VCDS software and establish a connection with your vehicle.
- Select the appropriate control module for the parameters you wish to monitor.
- Choose the desired measuring blocks (parameters) you want to see on the graph.
- Start the engine or perform the specific driving conditions you want to analyze.
- Observe the live data on the graph and look for any irregularities.
 VCDS Graph Boost Leak
FAQs about VCDS Graph
Q: Can I use VCDS Graph with any vehicle?
A: VCDS is specifically designed for Volkswagen Group vehicles, including Volkswagen, Audi, Seat, Skoda, and Bentley.
Q: What are some common uses of VCDS Graph?
A: Common uses include diagnosing boost leaks, checking fuel injector performance, monitoring engine timing, and analyzing sensor readings.
Q: Do I need any special skills to interpret VCDS Graph data?
A: While basic automotive knowledge is helpful, there are numerous online resources and forums dedicated to VCDS, where you can find guides and seek assistance from experienced users.
Conclusion
VCDS Graph is a valuable tool for any Volkswagen Group vehicle owner. Whether you’re a DIY mechanic or simply want to gain a deeper understanding of your car’s inner workings, VCDS Graph can empower you with the knowledge and insights needed for effective diagnostics and maintenance.
For more information on VCDS and other automotive diagnostic tools, visit CARDIAGTECH.