When it comes to diagnosing and troubleshooting your vehicle’s intricate systems, the right tools can make all the difference. This is where VCDS (Vag-Com Diagnostic System) shines, providing a powerful interface to delve into your car’s control modules. One key feature within VCDS is the “Display Depiction,” a crucial element for interpreting data and understanding your vehicle’s inner workings. This guide explores the ins and outs of display depiction in VCDS, empowering you to unlock its full potential for efficient vehicle diagnostics.
Decoding Display Depiction in VCDS
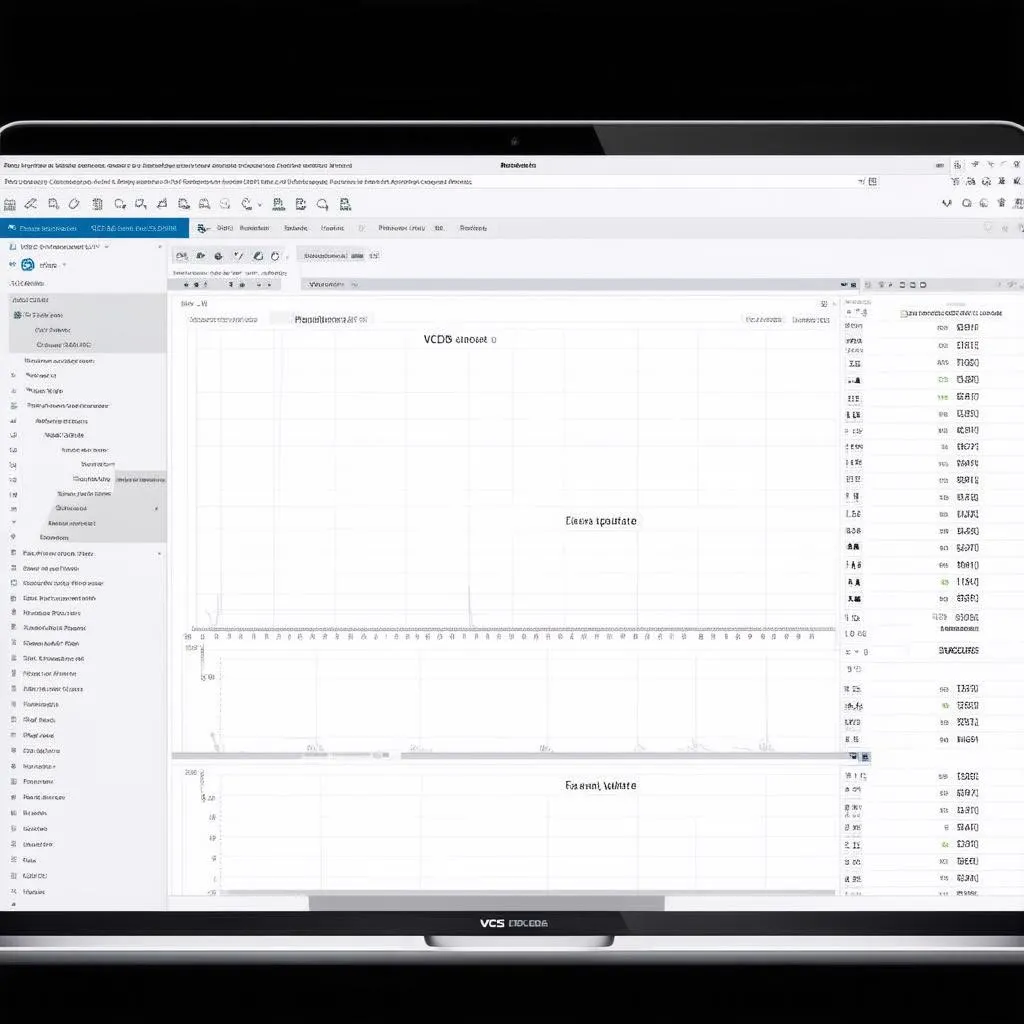
In essence, “Display Depiction” in VCDS refers to the visual representation of data retrieved from your vehicle’s control modules. Imagine it as a window into the complex world of sensors, actuators, and electronic signals that govern your car’s functions. Instead of raw data streams, VCDS translates this information into user-friendly formats – graphs, charts, and textual descriptions – allowing you to grasp the status of various systems at a glance.
The Power of Visuals in Diagnostics
Think of a mechanic listening to your engine; they’re interpreting sounds to identify potential issues. Similarly, VCDS’s display depiction enables you to “see” what’s happening within your car’s electronic brain. By visualizing data, you can:
- Identify trends: Graphs depicting sensor readings over time can reveal subtle patterns or deviations that might indicate a developing problem.
- Compare values: Display depiction often presents expected value ranges alongside live readings, making it easy to spot anomalies.
- Understand relationships: Some modules, like the engine control unit (ECU), involve complex interactions between sensors and actuators. Display depiction helps visualize these relationships, aiding in pinpointing the root cause of an issue.
Applications of Display Depiction
The beauty of display depiction lies in its versatility. It proves invaluable across various diagnostic scenarios, including:
- Emissions Testing Readiness: Quickly ascertain if your vehicle’s emissions systems are ready for testing, saving you from unnecessary trips to the inspection station.
- Sensor Monitoring: Observe real-time data from crucial sensors like the mass air flow (MAF), oxygen (O2), and throttle position sensor (TPS) to diagnose engine performance problems.
- Actuator Testing: Verify the functionality of components like injectors, solenoids, and motors by commanding them on/off and observing their response through display depiction.
 VCDS Display Depiction
Utilizing Display Depiction Effectively
While VCDS offers a user-friendly interface, maximizing the benefits of display depiction requires understanding its nuances. Here’s how to utilize it effectively:
- Select the Right Module: VCDS grants access to numerous control modules within your vehicle. Start by identifying the module relevant to the system you’re troubleshooting.
- Choose Appropriate Measuring Blocks: Each module presents a set of “measuring blocks” representing different data points. Refer to the VCDS documentation or reliable online resources to determine the relevant blocks for your specific needs.
- Interpret the Data: Familiarize yourself with the units of measurement and expected value ranges for the chosen measuring blocks. This understanding is crucial for accurate interpretation.
Tips for Enhanced Diagnostics
- Logging Data: VCDS allows you to log data from measuring blocks over time, proving invaluable for intermittent issues or analyzing performance under specific driving conditions.
- Comparing with Known-Good Values: Whenever possible, compare your vehicle’s data with known-good values from a similar model. This can help identify discrepancies and narrow down potential problem areas.
- Seeking Expert Assistance: While VCDS empowers DIY diagnostics, complex issues might necessitate the expertise of a qualified automotive technician. Don’t hesitate to seek professional help when needed.
Common Questions About Display Depiction in VCDS
Let’s address some frequently asked questions surrounding display depiction:
Q: Can I use display depiction to adjust settings in my vehicle?
While display depiction primarily serves as a visualization tool, certain adaptations or basic settings adjustments might be possible depending on the vehicle model and module. However, proceed with caution and refer to reliable sources or consult with a professional before making any changes.
Q: My display depiction isn’t showing any data. What could be wrong?
Several factors could contribute to this issue:
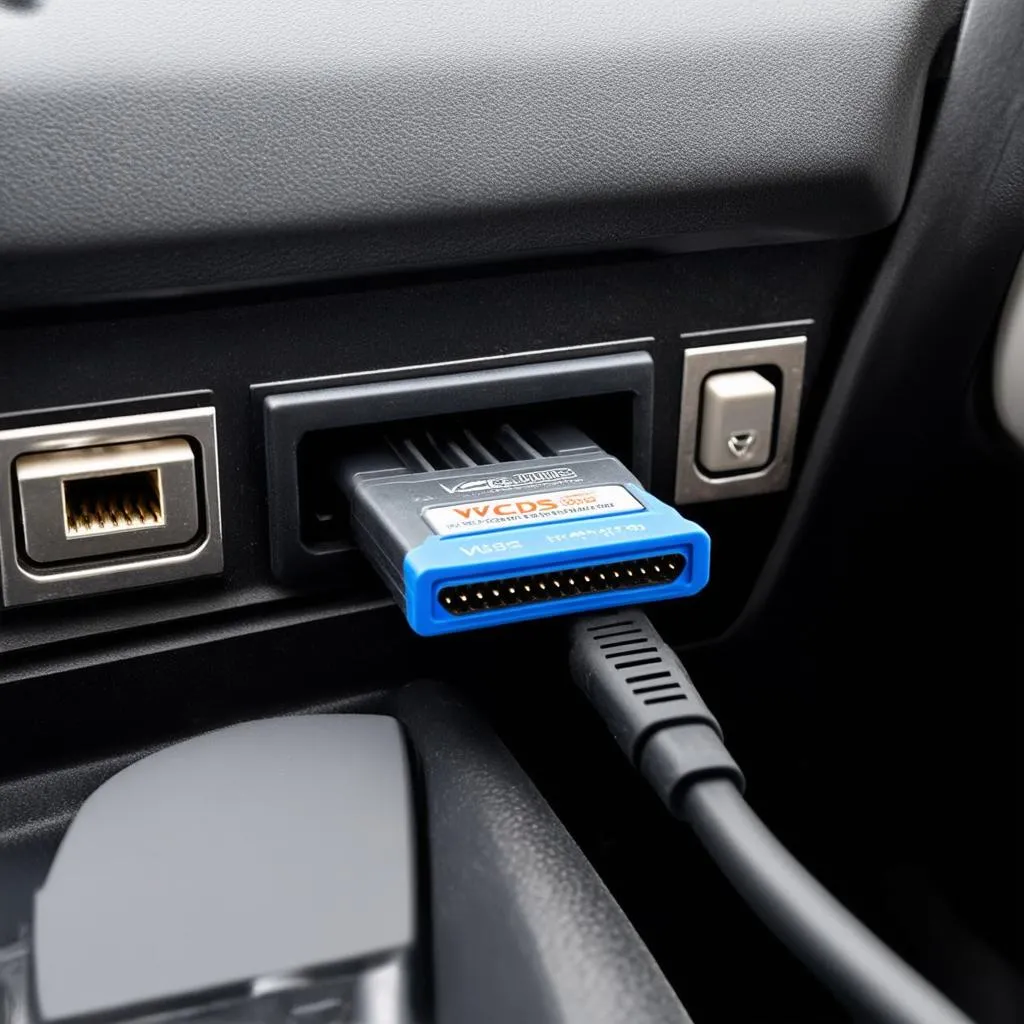
- Connection Problems: Ensure the VCDS interface is properly connected to both your computer and vehicle’s OBD-II port.
- Incorrect Module Selection: Double-check that you’ve selected the correct control module for the data you’re seeking.
- Faulty Control Module: In some cases, a malfunctioning control module might fail to communicate data properly.
Q: Is it possible to customize the display depiction layout?
VCDS offers limited customization options for display depiction, primarily focusing on selecting and arranging measuring blocks. However, it doesn’t allow for extensive layout changes like resizing graphs or adding custom elements.
 Car Diagnostics
Conclusion
Display depiction in VCDS stands as a cornerstone of effective vehicle diagnostics, offering a window into the complex electronic systems governing your car’s operation. By understanding its functions, mastering its application, and interpreting data accurately, you equip yourself with a powerful tool for troubleshooting, maintenance, and even performance optimization.
If you have any further questions or require specialized guidance on using VCDS for your specific vehicle, don’t hesitate to connect with the experts at CARDIAGTECH. Our team is dedicated to providing top-notch support and resources to empower both DIY enthusiasts and professional technicians alike.

